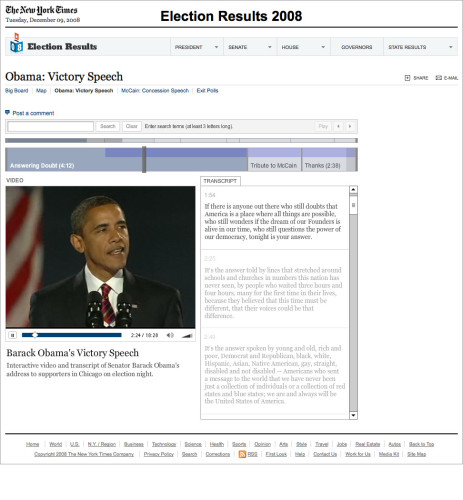
Election Results 2008
The New York Times, New York, New York, 2008
Description
For the 2008 presidential election, the graphics, interactive news, multimedia, design, video and production teams armed themselves with a large array of polling data, election results, live video feeds and geographic information. They then orchestrated these sources into a clear and compelling set of rich visualizations, maps and tools to present a narrative of the day's events as they unfolded across the nation and in every county.
Juror Notes
The interactive tools on the NYTimes.com website stand out for their clarity, inventiveness and responsiveness to the user and to the historical movement.
Collections:
AIGA 365: 30 (2009)
Repository:
Denver Art Museum
Discipline:
Information design
Format:
Information graphic, Website
Credits
- Design firm
- The New York Times
- Creative director
- The New York Times
- Art director
- The New York Times
- Designer
- The New York Times
- Editor
- The New York Times
- Information architect
- The New York Times
- Client
- The New York Times
Loading...
Loading...


