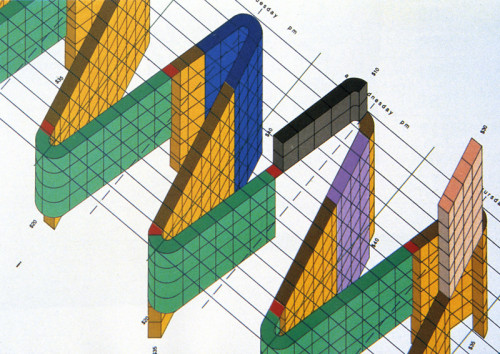
Diagram (Cost, Activity, Time)
Infogram, New York, New York, 1995
Description
Is it possible to integrate disparate elements in one cohesive environment using simple three-dimensional shapes, forms, and color? The designer created a diagram that combined the number, location, and cost of one weeks’s worth of student activities as part of a class project while studying at the Rhode Island School of Design.
Collections:
Information Graphics: Design of Understanding
Repository:
Denver Art Museum
Discipline:
Information design
Format:
Information graphic, Diagrams
Credits
- Design firm
- Infogram
- Art director/designer
- Ronnie Peters
- Client
- Rhode Island School of Design
Loading...
Loading...